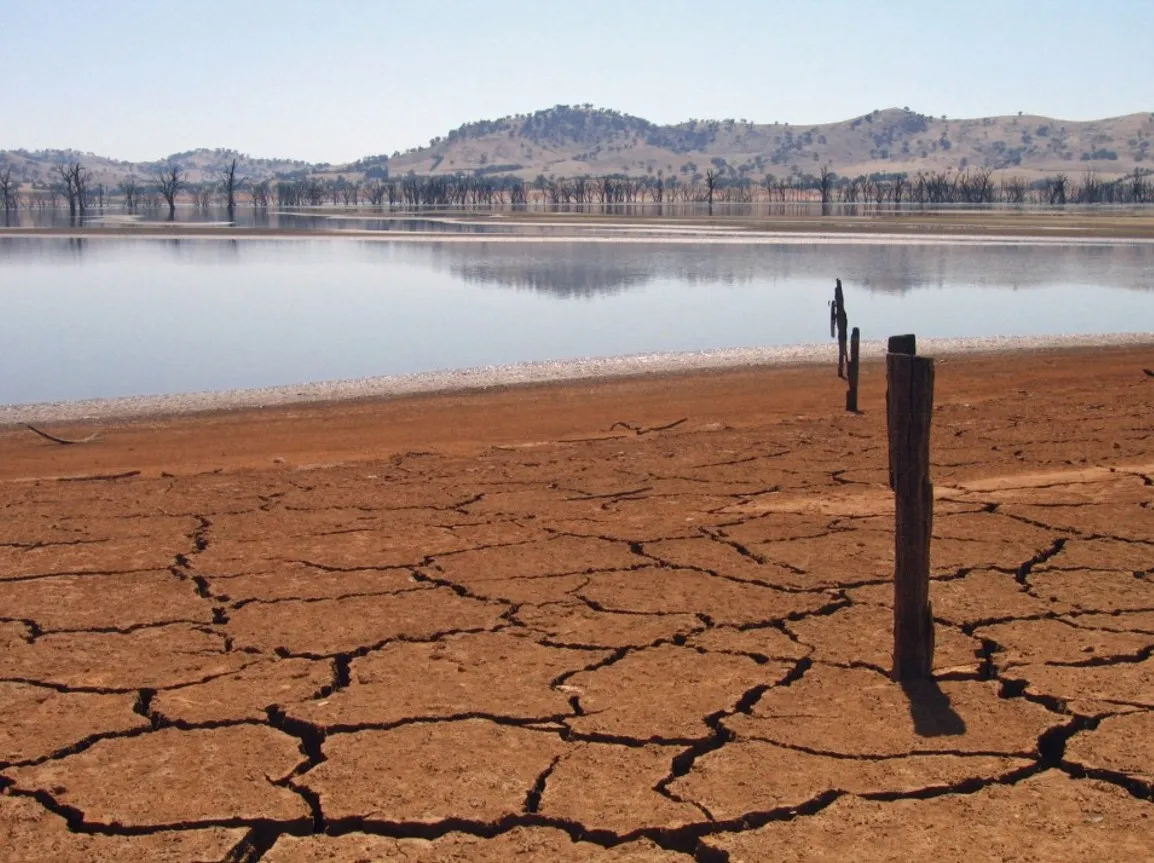
The Current Situation
Many parts of Australia, and specifically New South Wales, are currently experiencing severe drought conditions. Next week, on 10 December, the Greater Sydney region will move to Level 2 Water Restrictions with dam levels falling to just 45%. These restrictions mean gardens can only be watered before 10am or after 4pm with a watering can or bucket, cars must be washed with a bucket and a permit is required to before filling any swimming pool. Those who break these rules risk fines of $220 for individuals and $550 for businesses.
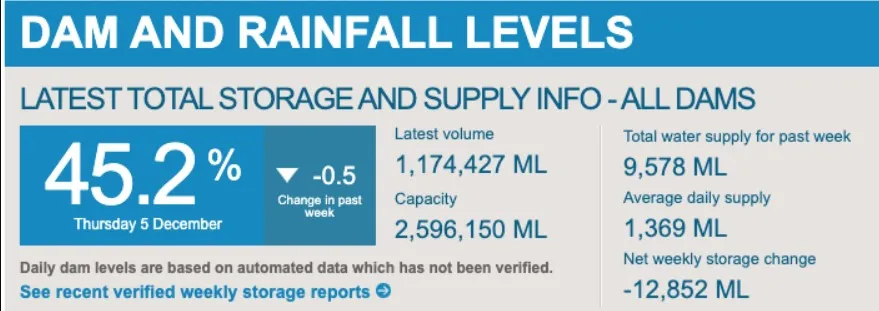
Usually Level 2 Water Restrictions would come in when dam levels fall below 40%. However, the State Government has taken the measure of implementing these earlier given the seriousness of the situation. Premier Gladys Berejiklian said “Given the rapid rate of decline of our dam levels we have decided to enact the next level of restrictions sooner than planned. We’re experiencing one of the most severe droughts on record and we expect introducing Level 2 restrictions to save 78.5 gigalitres of water per year.
“Given the rapid rate of decline of our dam levels we have decided to enact the next level of restrictions sooner than planned. We’re experiencing one of the most severe droughts on record and we expect introducing Level 2 restrictions to save 78.5 gigalitres of water per year.”
The 2003-2009 Drought
The last time the Greater Sydney region was under water restrictions was a period from October 2003 through to June 2009.
Since 2009, while water restrictions weren’t in place, an initiative called Water Wise has tried to influence long-term water use habits by making suggestions on how small savings can be made by households to be more efficient with their water.
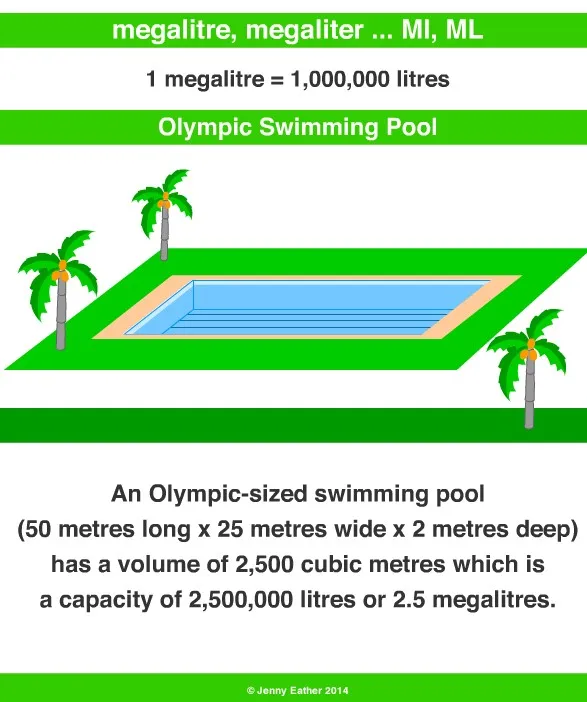
When the 2003 drought hit, a large NSW water utility had leakage in excess of 180 megalitres per day (MLD). Or, if using the pseudo-international leakage measure of representing this with volume with Olympic Sized Swimming Pools (OSSP), it would be 72 OSSPs. Or it’s one hundred nine billion five hundred million (109,500,000,000) bottles of water that you buy from 7-Eleven.
This is a lot of water! Particularly when a region is experiencing drought.
Leakage Reduction Activities During Drought
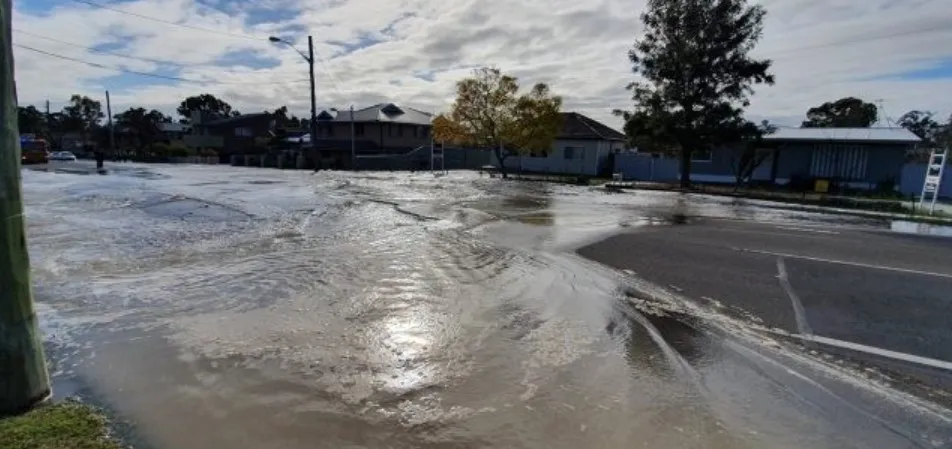
In periods of drought, all stakeholders are more aware of any wastage occurring. Water consumers do not like to be told to save water by not washing their cars or having short showers, only to walk out their front door to see a burst water main spilling thousands of litres per minute over the road. This increased awareness leads to more scrutiny, particularly by the media, and sometimes the Shadow Ministry.
Through collating publicly available information on leakage levels and active leak detection activities, we can see what occurred during the 2003-2009 drought to understand if similar will occur during this drought. As mentioned above, a large NSW water utility had leakage in excess of 180 MLD in 2003 when the drought commenced. By June 30 2010, this had reduced to 99 MLD.
There was no doubt a vast number of initiatives and investments undertaken to reduce the leakage over this period. Specifically, actively finding leaks on the water reticulation network (active leak detection or ALD) increased significantly, when measured by kilometres inspected, during the drought period. This is indicated by the green line in the chart below. Interestingly the level of activity, once again measured by kilometres inspected, dropped after the Level 3 Water Restrictions ended and it subsequently led to an increase in leakage.
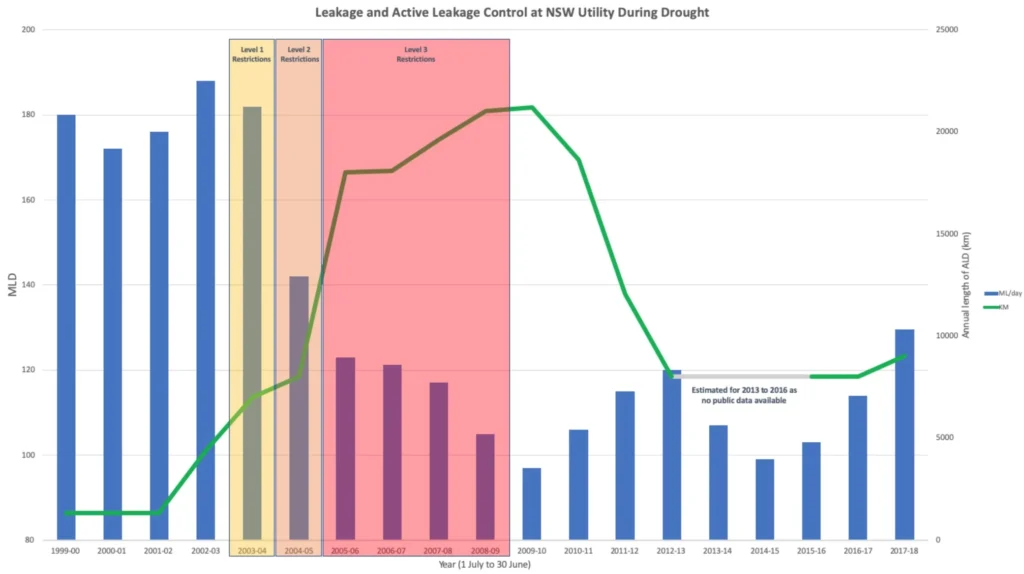
Source: The data for the above chart has been collated from publicly available sources.
Unfortunately, I could not find ALD information for the four-year period commencing 2012-13. However, it was noted in 2016-17 that a total of 217,635km of ALD had been undertaken since the program commenced in 1999. Using the other available data, it gives us an average of 8,000 km over those four years.
Observations
- While the reduction of leakage cannot be entirely attributed to ALD activities, there does appear to be a strong relationship between an increase in ALD activities and the reduction of leakage. The inverse is also true.
- In periods of drought efforts to reduce leakage increased. For example, 4,400 km of ALD were completed in 2002-03, but three years later, while in the middle of Level 3 Water Restrictions, this increased by 300% to 18,000 km.
- There is reduced efforts to either reduce leakage further, or keep leakage at current levels, when a period of drought ends.
- In the year after the drought ended (2009-10), leakage at this utility was at its lowest level ever at 97 MLD. In the eight years since, it has increased over 30% to 130 MLD (this is to June 2018).
Conclusions
As we move to Level 2 Restrictions, are we going to see an increase in water loss reduction activities across NSW similar to that observed in 2003-2009 period? Or, is it more a case of understanding if we doing enough to reduce water lost from our networks in periods when we are not in drought?
Has the Economic Level of Leakage changed and influenced the level of investment in the activities over the past decade?
With many global cities moving to advanced smart networks to identify network faults in near real-time (read here about the award winning SA Water Smart Water Network), at what point do smart systems get viewed for their ability to contribute meaningfully towards leakage reduction and not just for customer service benefits such as identification of disruptive bursts?
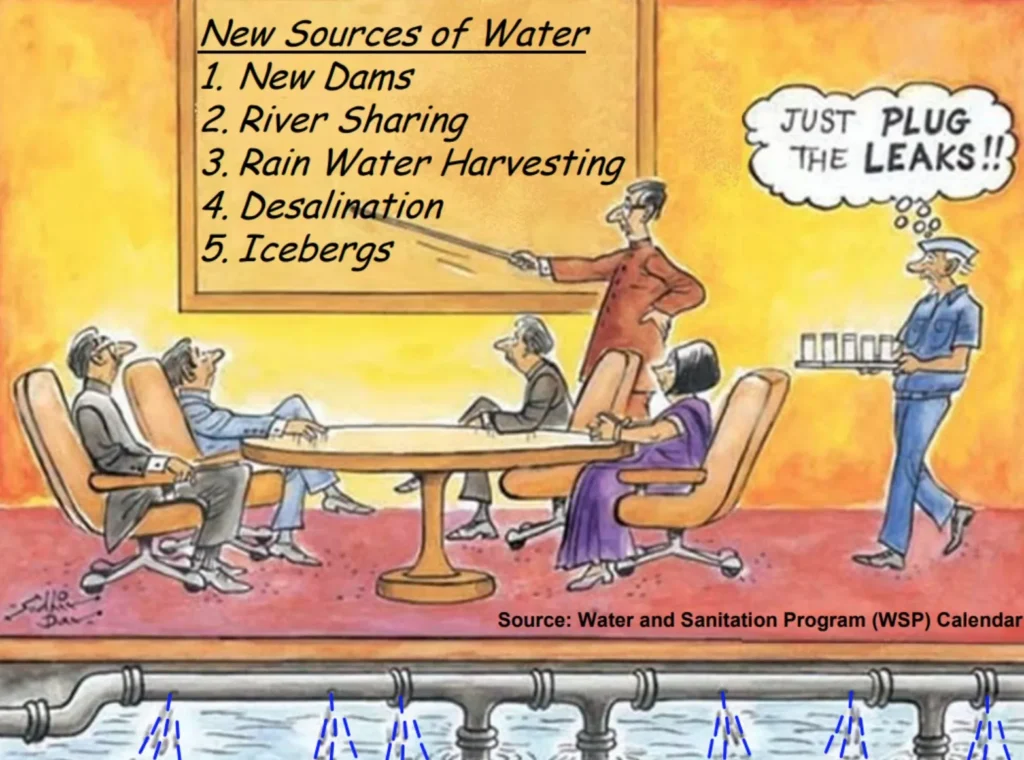
During decisions about building or expanding desalination plants, do water loss reduction activities get spoken about or are large capital projects always going to be favoured?
As highlighted by this weeks inaugural World Water Loss Day, if global water losses were reduced by just 30%, an additional 800 million people could be supplied with already treated water. Even if particular regions are leading by global standards, the impact we can make collectively is so significant it should not be ignored and we can always do more.
The comments in this article are my own.
Published by Hugh Chapman, Managing Director at Aqua Analytics on 6 December 2019
